Example scripts
This is a set of example scripts from the examples directory.
[Work-in-progress!]
How curves work
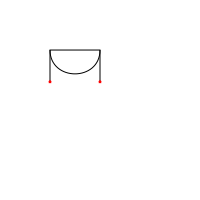
# about:
#   Demonstrate how the different parameters of curves work.

size(200,200)
import math

# Setup colors: no fill is needed, and stroke the curves with black.
nofill()
stroke(0)

# Set the initial position
x,y = 50, 50
width = 50

# The dx and dy parameters are the relative control points.
# When using math.pi/2, you actually define the lower half
# of a circle.
dy = width/(math.pi / 2)

# Begin drawing the path. The starting position is on the
# given x and y coordinates.
beginpath(x, y)
# Calculate the control points.
cp1 = (x, y + dy)
cp2 = (x + width, y + dy)
# Draw the curve. The first four parameters are the coordinates
# of the two control curves; the last two parameters are
# the coordinates of the destination point.
curveto(cp1[0], cp1[1], cp2[0], cp2[1], x + width, y)
# End the path; ending the path automatically draws it.
endpath()

# To demonstrate where the control points actually are,
# we draw them using lines.
# The first control point starts at the x,y position.
line(x, y, cp1[0], cp1[1])
# The second control point is the ending point.
line(x + width, y, cp2[0], cp2[1])

# To liven things up just a little bit, little ovals are
# drawn in red on the position of the control points.
nostroke()
fill(1,0,0)
oval(cp1[0] - 2, cp1[1] - 2, 4, 4)
oval(cp2[0] - 2, cp2[1] - 2, 4, 4)